Indicators: from definition to construction
Authors and date
- Submitted on: September 8th 2021
- Jean-Yves Courtone: Inria research fellow
Definition
An indicator is the numerical translation of a phenomenon or concept 1. Indicators can be used to:
-
simplify information by making it understandable to a target audience,
-
describe a situation and allow comparisons in space and time.
An indicator is a construction: it requires raw materials, the basic data, and an operating manual, in this case, calculation conventions 1. These calculation conventions are chosen at each stage of the indicator's design and are decisive in the interpretation that can be drawn from it.
A distinction is generally made between simple indicators, which are based on a small number of data and whose scope is limited (e.g. unemployment rate) and synthetic indicators (or composite indicators) which combine several dimensions. The latter are generally intended for the general public for information or awareness-raising purposes.
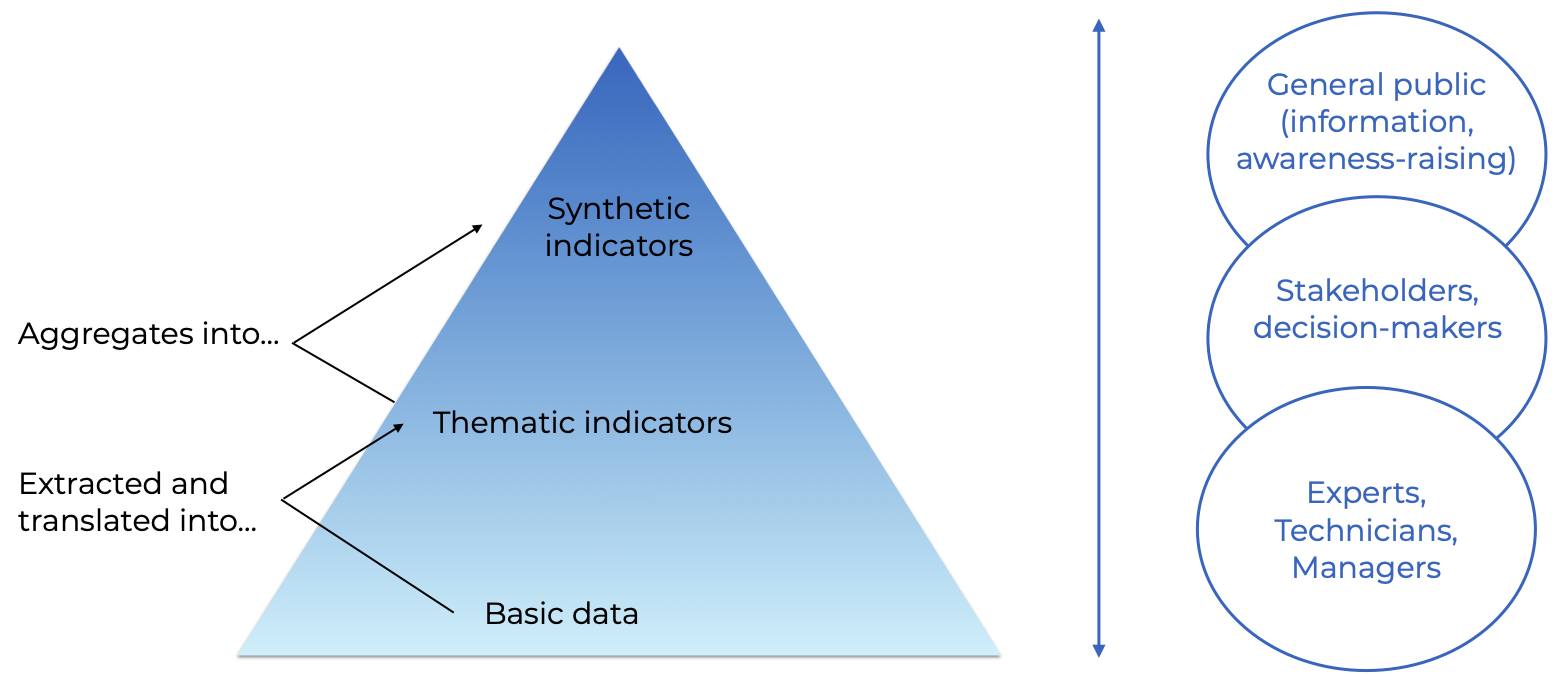
Indicator typology (Source: From Aurélien Boutaud 1)
About environmental indicators
There is a very large number of environmental indicators and each organisation generally builds a dashboard which is specific to its needs.
The indicators can be classified according to the environmental issue they address. For example, the French Ministry of Ecology has selected 22 key indicators to monitor 4 major environmental issues: climate change, biodiversity loss, resource scarcity and increasing environmental health risks 2. The report on the state of the environment in France 3 provides an even more comprehensive overview by comparing the indicators with global limits 4.
Another way of organising the indicators is the "Driving forces - Pressures - State - Impacts - Responses" framework. It distinguishes indicators that characterise:
- the human activities that cause the pressures (production and consumption patterns, inequalities, demographics, etc.)
-
the pressures themselves (consumption of resources and emissions of pollutants),
-
the current state of the environment (e.g. concentration of pollutants in the air, soil or water),
-
the ecological, social and economic consequences of environmental degradation,
-
the measures taken to reduce the extent of the problem.
Focus on two simple environmental indicators
Greenhouse gas emissions
Greenhouse gases (GHGs) are gaseous components that absorb infrared radiation emitted by the Earth's surface and thus contribute to the greenhouse effect. The main GHGs contributing to global warming are carbon dioxide (CO2), methane (CH4), nitrous oxide (N2O), tropospheric ozone (O3), as well as certain industrial halocarbons (used in particular for the production of refrigeration/air-conditioning).
These gases each have a different atmospheric residence time and a different warming power. This is why it is useful to weight them to express them in a common unit: the CO2 equivalent.
The Carbon Footprint method can be used to account for the direct and indirect GHG emissions of an organisation or a territory 5. territory 5.
Water footprint
Water footprint measures the freshwater appropriated (consumed or polluted) by a given entity which can be the whole of humanity, a country, a company, a household, a product etc. This indicator, expressed in m3, can be adapted in intensity measurement, for example m3/€, m3/ton of product, m3/ha.
It has three components:
-
"green" water corresponds to rainfall that is directly consumed by plants (evapotranspiration),
-
"blue" water corresponds to withdrawals from surface or groundwater bodies (drinking water supply, irrigation, water consumption by industry, etc.)
-
"grey" water corresponds to the volume of water that would be necessary to dilute the pollutants ending up in a water body in order to reach given quality standards (e.g. nitrogen concentration, chemical/biological oxygen demand, etc.).
An example of a synthetic environmental indicator: the Ecological Footprint (EF)
The design of a synthetic environmental indicator is complex. The OECD 6 has proposed a number of steps that are explained below and put into practice in the example of the ecological footprint.
Designing an indicator
The steps in designing an indicator are:
a) Definition of the objective, the target audience, and the dimensions to be taken into account
b) Identification of baseline data and development of simple indicators to represent each dimension
c) Normalisation of the indicators representing each dimension to make them comparable
d) Aggregation of the indices corresponding to each dimension.
There are two main families of methods:
-
those which consist of aggregating and then comparing (e.g. weighted average)
-
those which consist of comparing the alternatives two by two on a single criterion and then aggregating these comparisons.
It should be remembered that the weighted average, which is by far the most widely used, has very significant disadvantages that are often not perceived by designers: in particular, it allows compensation between criteria (a poor performance in one criterion can be counterbalanced by a very good performance in another criterion), which tends to penalise "balanced" alternatives, as the example below shows:
Pablo Lara Juan French 10 3 6 Math 3 10 6 Illustration of multi-criteria aggregation: with a weighted average, Juan can never be ranked first, no matter what coefficients are chosen! Source: Adapted from A. Rolland.
e) Uncertainty and sensitivity analysis to measure the impact of methodological choices made on the final value of the composite indicator
f) And finally the dissemination and valorisation of the results
The ecological footprint
Objective and scope:
The Ecological Footprint (EF) is an indicator developed by Global Footprint Network which aims to measure the bioproductive surface area required by a population to (i) supply it with the biomass resources it consumes, (ii) absorb its CO2 emissions. The issues of pollution (air/soil/water), depletion of non-renewable resources, depletion of water resources and biodiversity are outside the scope of the analysis. The dimensions taken into account are: the carbon footprint (understood as the surface area of forest necessary to absorb CO2 emissions), the forest footprint, the cultivated land footprint, the pasture footprint, the fishing footprint and the built-up land footprint (it is in fact considered that soil artificialisation takes place on arable land). For its promoters, the EF is intended for the general public but also for decision-makers.
Calculations made for each type of area
The EF proposes to calculate the consumption footprint of each country. This consumption footprint is related to the production, import and export footprints by the following equation:
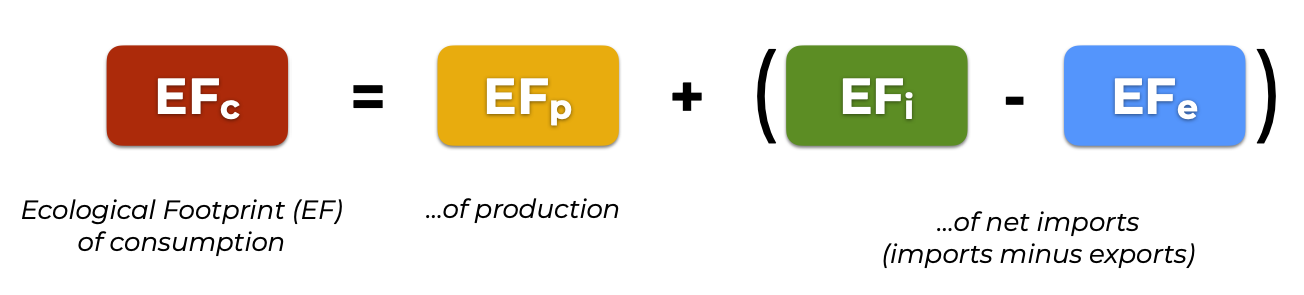
Ecological footprint (Source: From Global Footprint Network)
Let's take the example of forests. The production footprint (expressed in global hectares of forest) is calculated by dividing the amount of wood extracted in a given country (m3) by the average biological productivity (photosynthesis) of forests worldwide (m3/average world hectare).
To avoid double counting, only raw materials are considered in the calculation of the production of a footprint. However, all types of products (processed or not) are included in the import and export footprints. In the case of a processed product, it is necessary to determine how many raw materials were used to produce it. By-products are often present: for example, to make milk, a cow also produces calves. It is then necessary to allocate the footprints attributed to the cow between these by-products in order to avoid double counting, and different methods can be used for this (e.g. biophysical allocation according to the energy or protein content of each product, or economic allocation according to the value of each product).
Finally, a biocapacity is also associated with each type of surface. It represents what nature can produce as resources/absorb as CO2 each year, i.e. the maximum sustainable value for the footprint. The difference between footprint and biocapacity thus provides a measure of ecological overshoot.
These principles, described in more detail in 7 and 8, are applied to all types of surfaces described earlier.
Aggregation of different footprints and biocapacities.
To add up the different types of footprint (forests, crops, etc.), they are expressed in a common unit, the global hectare, which theoretically corresponds to one hectare of average biological productivity. In practice, each type of surface is given a weighting coefficient corresponding to its potential for food production (cultivated land has a greater potential than forests, which have a greater agronomic potential than pastures).
Attractions and criticisms of the Ecological Footprint.
The success of this indicator with the general public lies in its ability to define an ecological overshoot: it can be used to communicate about the "overshoot day" or the number of planets that would be needed to sustain one’s level of consumption. It is also an excellent way to learn about environmental accounting. However, EA has been criticised for being too simplistic (it is impossible to summarize the problems studied in a single dimension) and, above all, for greatly underestimating the extent of ecological overshoot, which prevents it from being used as a reliable indicator for public decision-making (see, for example, 9).
Lessons for environmental assessment
From these examples we can draw some key points for environmental assessment in general:
-
The producer vs. consumer perspective are two ways of allocating environmental pressures emitted around the world. Producer responsibility accounts for the pressures directly emitted by the system under study (and therefore theoretically physically measurable, even if in practice there are data gaps and uncertainties). The climate commitments made by countries at the COP adopt this view. Consumer responsibility accounts for the pressures emitted anywhere in the world to satisfy the consumption of the system under study. Its calculation is not unequivocal because it requires allocation rules that can be diverse (physical, monetary etc.). The two perspectives shed light on different aspects of the problem (production modes vs. consumption modes) and deserve to be analysed in parallel.
-
Avoiding double counting, notably through allocation methods
-
Define ecological overshoot by comparing the pressures exerted with the carrying capacity of the local or global environment. EFc10 and it also raises unavoidable normative questions: to determine a country's ecological overshoot, should the global carrying capacity be considered to be equally distributed among all human beings or should it vary according to the natural resource endowments of each country?
References
-
Aurélien Boutaud. Qu'est-ce-qu'un indicateur ? [online]. Millenium 3. Available at the M3 website. Accessed on 30 August 2021. ↩↩↩
-
Frédéric Vey, Anne-Sophie Hesse. Indicateurs de la stratégie nationale de transition écologique vers un développement durable: comparaison internationale situation 2018 [en ligne]. Commissariat général au développement durable - Service de la donnée et des études statistiques, Document de travail n° 42, juin 2019. Available at site développement durable.gouv. Accessed on 31 August 2021. ↩
-
Valéry Morard, Irénée Joassard, with the collaboration of Benoit Bourges. Rapport de synthèse, l'environnement en France 2019. Commissariat général au développement durable, 2019 [online]. Available at the sustainable development.gouv website. Accessed 31 August 2021. ↩
-
Centre ressource du développement durable. Les limites planétaires, un socle pour repenser nos modèles de société [en ligne]. CRDD,17/06/2021, MAJ 14/09/2021. Available at the CERDD website. Accessed 31 August 2021. ↩
-
Bilans GES. AEME. Disponible sur le site de l'ADEME. Accessed on 01 Sept 2021 ↩↩
-
OECD. Handbook on Constructing Composite Indicators, Methodology and User Guide [online]. OECD, 2008. Available at the OECD website. Accessed 30 August 2021. ↩
-
Aurélien Boutaud, Natacha Gondran. L'empreinte écologique. La Découverte, 2010 ↩
-
David Lin, Laurel Hanscom, Jon Martindill, Michael Borucke, Lea Cohen, Alessandro Galli, Elias Lazarus, Golnar Zokai, Katsunori Iha, D. Eaton, Mathis Wackernagel. Working Guidebook to the National Footprint and Biocapacity Accounts [online]. Global Footprint Network, 2019. Disponbile sur le site. Accessed 30 August 2021. ↩
-
M. Giampietro. Footprints to nowhere. Ecological Indicators, 2014, 46. ↩
-
Anders Bjørn, Katherine Richardson, Michael Zwickly Hauschild. A framework for development and communication of absolute environmental sustainability assessment methods [limited access]. Journal of Industrial Ecology, 2019, voL. 23,n° 4. Available from access at the publisher's website. Accessed 22/10/2021 ↩